Implement machine learning in a Power BI Dashboard

You have completed machine learning model training in Python. Then, you want to implement that model and use the model prediction in the Power BI dashboard. This article will tell you how to do that.
Azure Machine Learning is the formal way to integrate machine learning in Power BI. However, I will use an informal method by using Python to import the trained model and make a prediction.
Requirement
You must finish setting up Python in Power BI.
The article below will show you how.
Install the joblib library in the Anaconda environment to load the model file.
pip install joblibStep summary
- Train a model in Python
- Load data in Power BI
- Implement the model in Power BI
1. Train a model in Python
I will not go into detail about machine learning here. This is only to get a model as an example.
The data is the Iris dataset we are familiar with. You can download the dataset below.

import pandas as pd
from sklearn.model_selection import train_test_split
from sklearn.tree import DecisionTreeClassifier #for using Decision Tree Algoithm
import joblib# Load csv file
iris = pd.read_csv("Iris.csv")# Prepare training data
X = iris.drop('species',axis=1)
y = iris['species']
X_train, X_test, y_train, y_test = train_test_split(X,y, test_size = 0.2, random_state = 42)# Model training
model=DecisionTreeClassifier()
model.fit(X_train,y_train)# Save model
joblib.dump(model,"model.joblib")
In this code, I load the data, train a model and save the trained model using the joblib library (You may also use the pickle library to save the model).
This model will receive flower properties as input and predict the iris species of that flower.
The model file is “model.joblib”. I will later load this file in Power BI to perform prediction with this model.
2. Load data in Power BI
Load the data you want to predict to Power BI.
Make sure that the columns are similar to the train data.
I will assume that my new data will be in csv file. I will create a new file “Iris_new.csv” which is like the IRIS.csv file I use in model training in step 1 except that there is no species column (I want to predict the species column).

Open Power BI. Click the Home tab, select Getdata, and select Text/CSV.
Home tab > Get data > Text/CSV
Then, select the Iris_new.csv file and Load the data.

3. Implement the model in Power BI
Let’s load the model from the joblib file and create a new column to show the prediction result.
- Click Transform data

2. Select the query you want to transform

3. In the Transform tab, click Run Python script

4. You will see a new Run Python script window. Write your code below and click ok.
# 'dataset' holds the input data for this scriptimport joblib# Load model pipeline
model = joblib.load("xxx/model.joblib")dataset['prediction'] = model.predict(dataset[['SepalLengthCm','SepalWidthCm','PetalLengthCm','PetalWidthCm']])

Code Explanation
- Use joblib to load the model.joblib file. Change argument to your file location.
- Create a new dataframe column called prediction and use model.predict with the dataset to give the prediction.
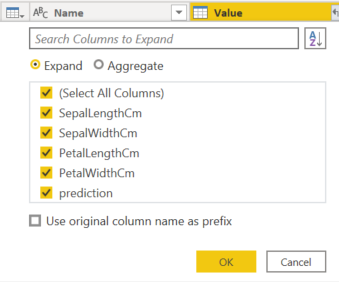
6. The result will be a table. Click to expand the table. Make sure that ‘Use original column name as prefix’ is not checked.


7. You will see a new prediction column which is the predicted Iris species and the steps are added in the APPLIED STEPS plain.


8. Click Close & Apply

Now, you can use prediction results to create any dashboard you want.
Comments
Post a Comment