Text Visualization
Text is an essential aspect of any dataset, whether it be business data, social media data, log data, etc., and it’s essential to analyze as it makes up a considerable chunk of unstructured data generated.

Its mainly used to understand and gather interesting insights which can be used for business or research.
Day-to-day text data quantity is increasing, with data collection being feedback like emails, social media, and survey responses. This data doesn’t have any context (like most people’s life) and meaning without proper software and formatting, as the volume is overwhelming, making text analysis an absolute necessity.
And necessities need to be fulfilled (necessity of drinking water take this as a reminder to drink water) that is when Power BI comes into the picture ( they have rewrapped it .. great btw), it is a data visualization tool provided by Microsoft. It has various data manipulation tools such as Power Query, DAX, Word Cloud, and a lot more. Let’s explore these now.
I have done an analysis of the below dataset
This dataset comprises around 6500 data from social media, Facebook comments, posts, etc. All the people selected for data annotation are very well in English Language and are undergraduate students. The majority of voting is the final depression of the data.
Coming to Power BI now,
The process flow chart of what is to be done is shown below,
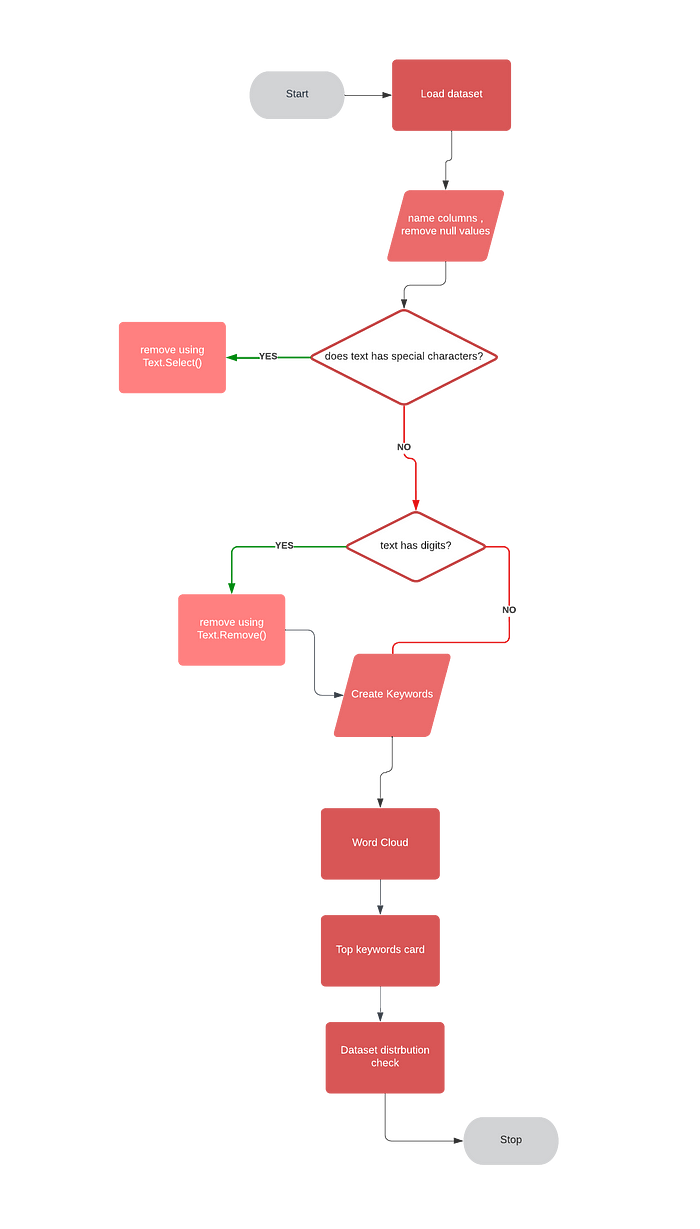
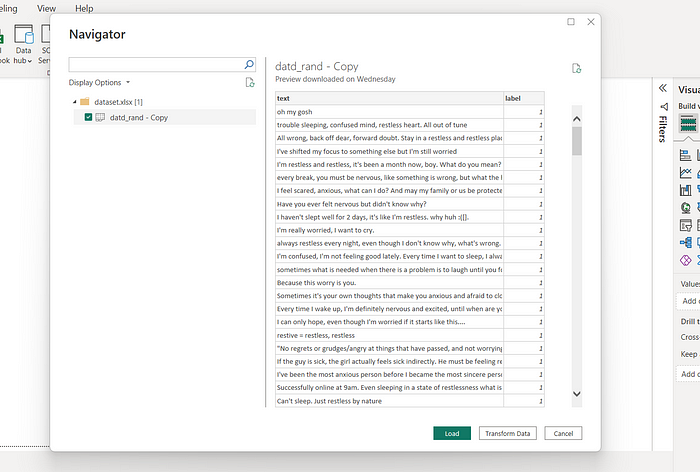
Firstly, the dataset is loaded onto it
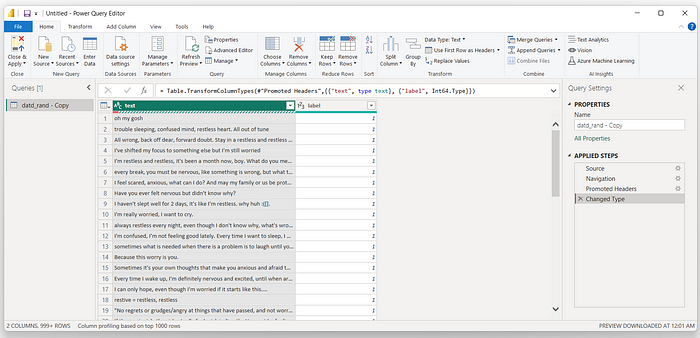
After loading the dataset into Power BI it is preprocessed, which includes cleaning NULL values, removing the punctuations, removing digits, removing special characters etc.
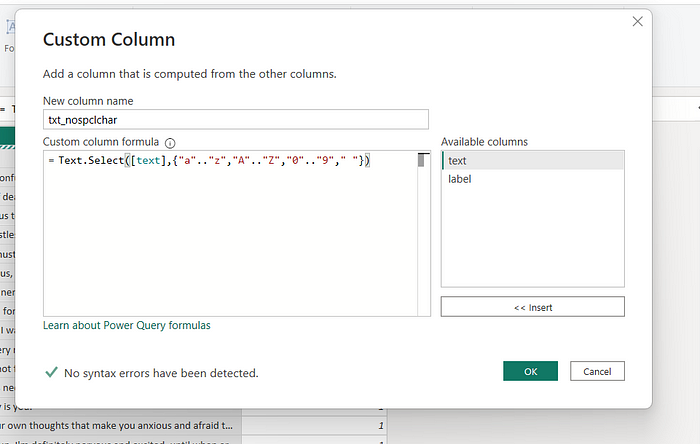
Special characters such as &,@,:,//,/ causes data redundancy as they don’t necessarily provide meaning to the model/software and are mostly unused, so they are being removed from the text column using Text.Select function ( characters not specified in range of select characters are removed, and the new copy made is returned) in Power Query.
The same is the case with numbers they also need to be removed as they don’t provide any meaning in textual context usually, so they are removed in this case, from txt_nosplchar column using Text.Remove function ( removes character specified from the provided text and returns the new copy made) in Power Query.
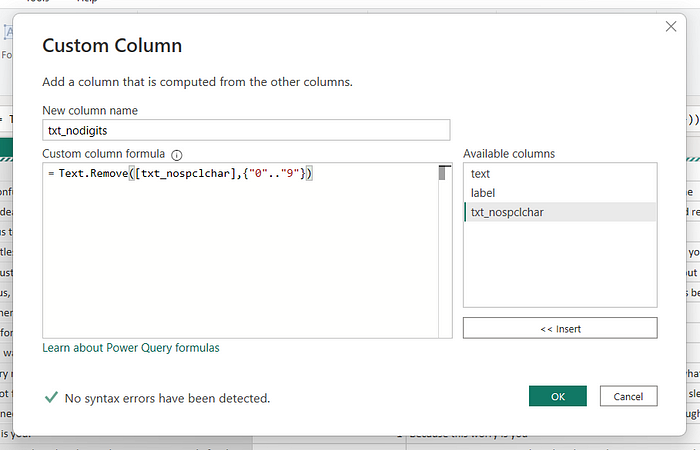
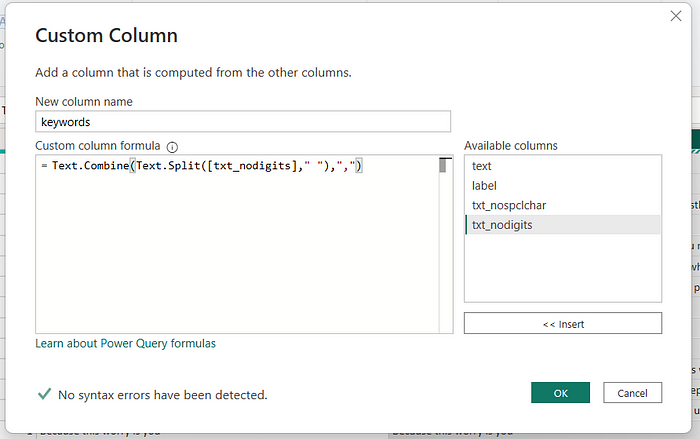
I want to create one more column of keywords from the text found in the table so for doing that I am splitting the row data based on space and combining them using commas creating sets of words ( in this case keywords), this all is done using Text.Combine function ( combines text based on input and separater provided in this case comma ) and Text.Split function ( which split/separates the text based on separater provided ) in Power Query.
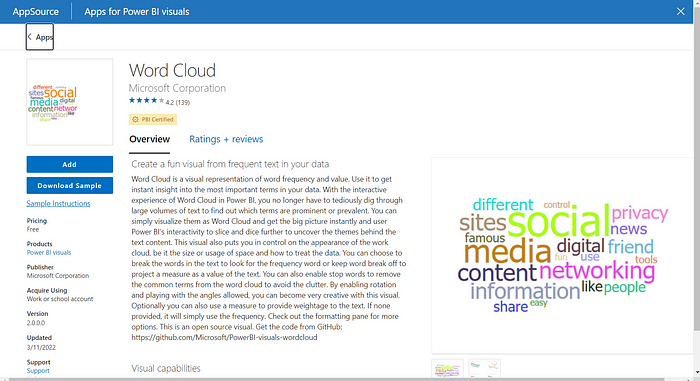
Word Cloud( visuals of word frequency and value ) is an important and frequently used visualization in text analysis, this visualization is not provided by default in Power BI it needs to be downloaded and added from Import more visuals section in Power BI.
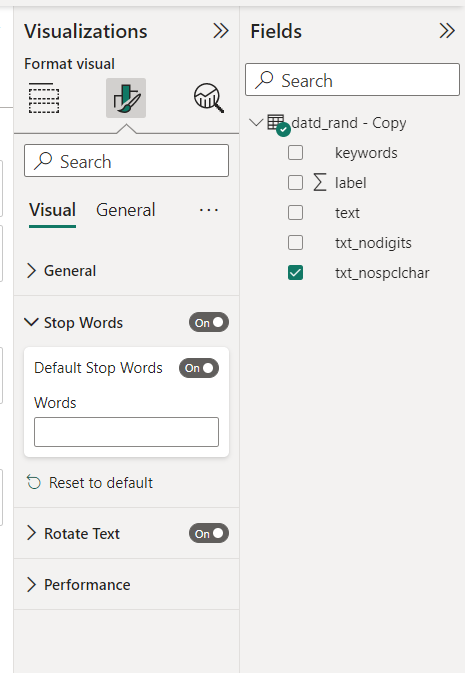
Word Cloud has a handy feature known as stop words filter that removes stop words (like the, is, a) from the sentences as they are insignificant in finding any information.
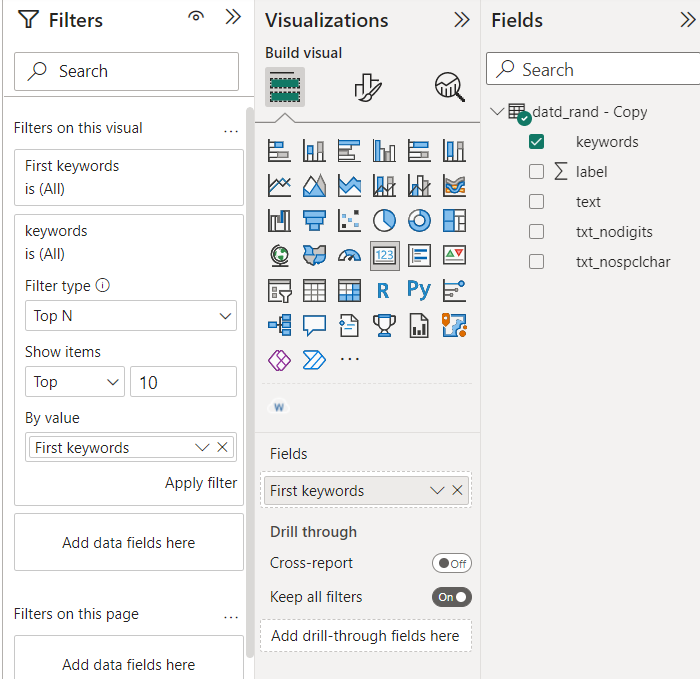
Now remember the keywords column we made earlier, it’s gonna get used now as in this case, I want to see the top occurring keywords in all of this table which is done using Filters present in Power BI and specifically Top N filter that gives Top N ( number of rank like top 10) from the column, in this case i am finding Top 10 keywords from whole keywords column.
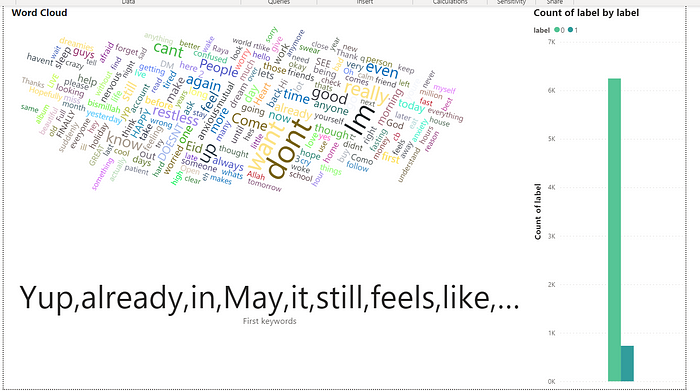
Adding a distribution stacked bar graph having label count showing the distribution of labels in the dataset.
After combining all of these graphs, a kind of Dashboard is created in this case containing, stacked bar chart of labels placed in dataset, word cloud and card showing top occurring keywords in the column.
Comments
Post a Comment