What is Data Modelling
What is Data Modeling in Power BI?
is Data Modeling in Power BI?
We often get the data in multiple tables and connect them, and creating a relationship between them is called “Data Modeling.” By creating a relationship between tables, we insist that Power BI know how these tables are connected and create reports from different fields of different tables using Power BI data modeling. It is one of Power BI’s key strengths because it does not necessarily demand all the data be in a single table. Rather, you can have data in different tables and define a relationship between those tables with a common column.
You are free to use this image on your website, templates, etc., Please provide us with an attribution link
Create Data Modeling in Power BI
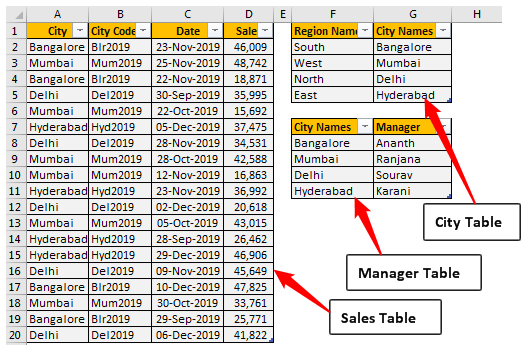
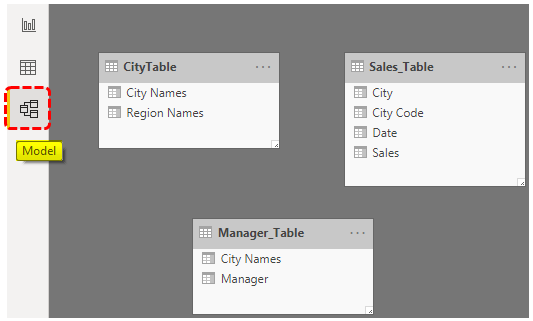
To create a relationship between data table in Power BI, you need Data Tables to work on. We have below three tables to work with: “Sales Table,” “City Table,” and “Manager Table,” respectively.
Copy and paste the data directly to Power BI, or you can copy the data to an excel file and then import it to Power BI as an Excel file reference. So, you can download the Excel workbook template from the link below, which is used for this example.
I have directly uploaded the data to Power BI.
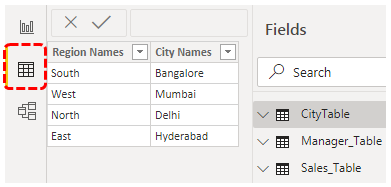
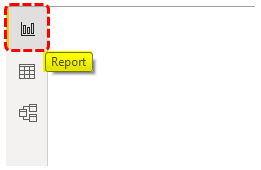
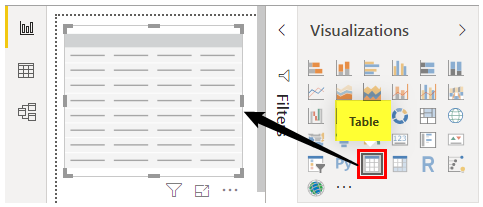
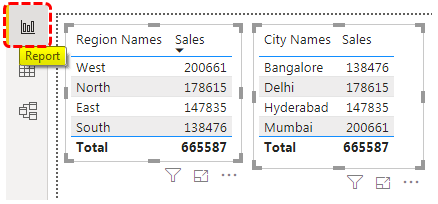
- Now, open the “Report” view.
- As you can see below, we have used the “Table” visual.
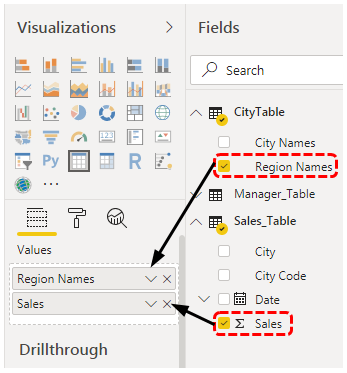
- Try to create a “Zone-wise” sales summary table by choosing “Region Names” from “CityTable” and “Sales” Value from the “Sales” table.
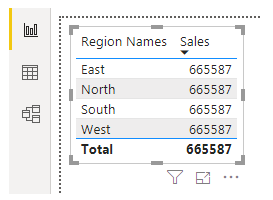
- Our summary table shows the same value for all the regions, as shown below, because we have used two different columns from two different tables.
- Similarly, create one more table visualization to create a “City-wise” summary table. This time use “City Names” from the “Manager Table” and “Sales” value from the “Sales” table.
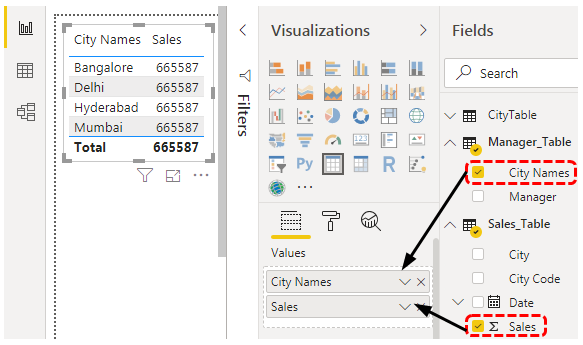
Even though the “City Names” are in both tables, we still get the same numbers because Power BI cannot recognize the relationship between these three tables.
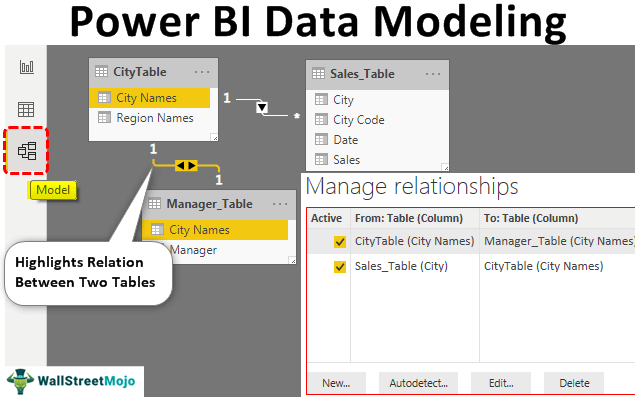
- Now, come back to the “Relationship” tab. As you can see, we have three tables with their respective names.
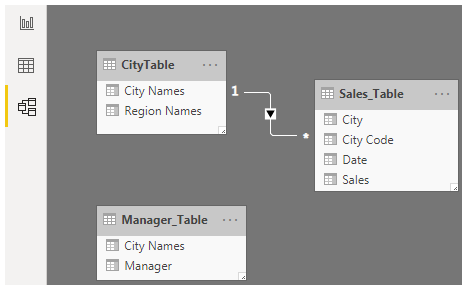
First, look at the “Sales_Table” and “CityTable” in these two tables’ common column is “City Name.” So, use this column to create a relationship between these two tables using Power BI data modeling.
- Now, from “CityTable,” drag and drop the “City Names” column to the “City” column in “Sales_Table.” It creates a line between “CityTable” and “Sales_Table.”
- If you want to know which column has created the relationship between these two tables, then place the cursor on the connector line between these two lines. It will highlight two common columns in respective tables.
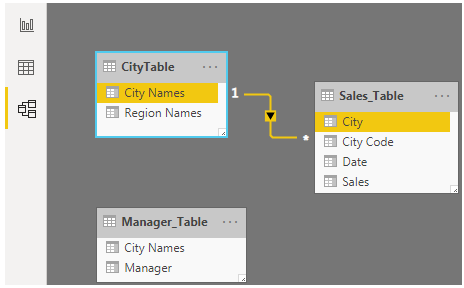
Here you go, it says the relationship between two columns in these two tables is “City.”
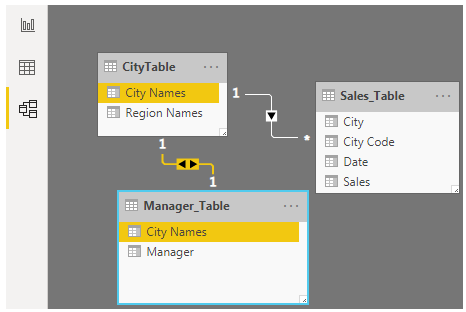
- Now, we have one more table, i.e., “Manager_Table.” This table includes the city-wise manager list. The city is there in the other two tables as well, but this time, we will create a relationship between “CityTable” and “Manager_Table,” not with “Sales_Table.”
- Now, return to the “Report” tab and see the result in the two initially created tables. This time it recognizes the relationship between tables. Accordingly, it has displayed results against each city and region.
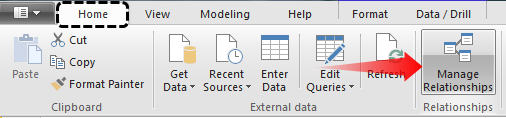
- You may click “Manage Relationship” under the “Home” tab to see and manage the relationship between tables.
- It will open all the relationship lists. You can “Edit” or “Delete” these relationships by clicking on the respective buttons.
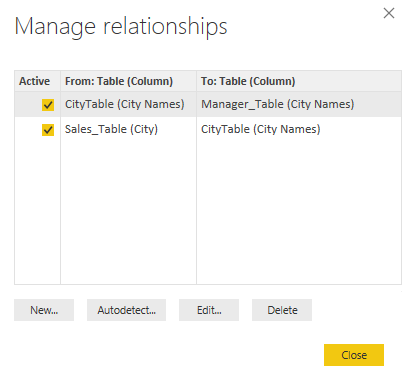
As you can see above, the first relationship list says, “CityTable (City Names)” is connected to “Manager_Table (City Names),” and the second list says “Sales_Table (City)” is connected with “City_Table (City Names).”
- Get link
- X
- Other Apps


Comments
Post a Comment